
Data-driven Light & Sound Kinetic Installation
General Information
- Initiative
- Resonances IV NaturArchy
- Subject Matter
Tipping points, climate change
- Lead Artist
- Yiannis Kranidiotis
Project Description
- Short description
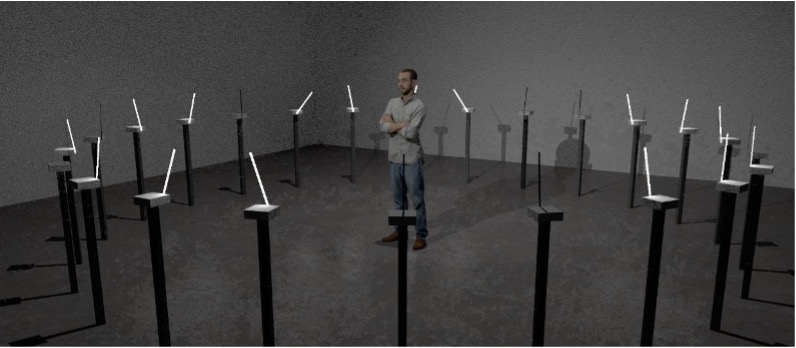
“The Tipping Point” (working title) is a proposal for a data driven light and sound kinetic installation of 24 custom metronomes. The artwork highlights the urgency and the increased risk that one or several tipping elements in the climate system might cross a critical threshold, resulting in severe consequences for the global climate, ecosystems and human societies.
- Full description of the artwork/installation
Each metronome has a light emitting rod that will be moving and pulsating in different frequencies like a normal music metronome. All metronomes can be controlled from a central microcontroller. At the begging all metronomes stand without motion. Then the data from the global temperature rise per year will start to feed the installation and one by one the metronomes will start to operate (moving, emitting light and ticking). As the global temperature will rise, the metronomes will be oscillating faster in higher frequencies. At some random point all metronomes will stop immediately. This moment is the tipping point of the climate change where temperature rise will start to activate other catastrophic events. The installation will stay still and silent for a couple of minutes. After this pause the installation will reset and start over again.
The sound of each metronome will be a simple "tick" sound. This will sound like a Geiger counter, the instrument used for detecting radiation. As more and more metronomes will start to tick fast, the overall soundscape will resemble the alarming sound of a Geiger counter approaching a dangerous radioactive space (please watch the video by following the link provided on the next page).
For a better understanding of the setup, motion light, and sound, I created a 3D video simulation of the installation.
Follow the link bellow, to watch it: https://www.youtube.com/watch?v=Aeb56OovjHU
3D rendering of the installation
- Concept
“The Tipping Point” (working title) is a proposal for a data driven light and sound kinetic installation of 24 custom metronomes. The artwork highlight the urgency and the increased risk that one or several tipping elements in the climate system might cross a critical threshold, resulting in severe consequences for the global climate, ecosystems and human societies. Using data from the IPCC Sixth Assessment Report12 the installation begins a journey through the rise of the global temperature. Starting from 1950 to the present and then to the future as describe on the SSP513 (Shared Socioeconomic Pathways) projection model, a future where fossil fuel will still be the basis of our economy and energy system.

3D rendering of the installation 
3D rendering of the installation
- Context
UN Secretary-General Antonio Guterres recently said, “…time is running out. Irreversible climate tipping points lie alarmingly close.”1
Greenhouse gases from human activities are the most significant driver of observed climate change since the mid-20th century2. As greenhouse gas emissions from human activities increase, they build up in the atmosphere and warm the climate, leading to many other changes around the world—in the atmosphere, on land, and in the oceans. Because many of the major greenhouse gases stay in the atmosphere for tens to hundreds of years after being released, their warming effects on the climate persist over a long time and can therefore affect both present and future generations.
A central objective of the European Green Deal3 is to set out the trajectory for the EU to be climate neutral by 2050. As a milestone towards this target, the EU Commission proposed a 2030 target to reduce greenhouse gas emissions by 55 per cent compared to 1990.
A tipping point is the point at which small changes become significant enough to cause a larger, more critical change that can be abrupt, irreversible, and lead to cascading effects. The concept of tipping points was introduced by the IPCC 20 years ago, but then it was thought they would only occur if global warming reached 5°C. Recent IPCC assessments, however, suggested that tipping points could be reached between 1°C and 2°C of warming.
Here are the major climate tipping points. Greenland ice sheet:
The Greenland ice sheet contains enough water to raise global sea levels by over 6m and its melting is accelerating. From 1992 to 2018, it lost close to four trillion tons of ice. While its disintegration is not likely to be abrupt, there could come a point beyond which its eventual collapse is irreversible for millennia.
The West Antarctic Ice Sheet (WAIS): The WAIS is vulnerable to collapse because it sits on bedrock below sea level and is affected by the ocean’s warming. A new study4 found that if the WAIS melted, it could raise sea levels three feet more than previous projections of 3.2m; Antarctica as a whole contains enough ice to raise global sea levels by over 70m.
Atlantic Meridional Overturning Circulation (AMOC): The AMOC is one of the main global ocean currents and is critical to regulating climate. Cold salty water, which is dense and heavy, sinks deep into the ocean in the North Atlantic, and moves along the bottom until it rises to the surface near the equator, usually in the Pacific and Indian Oceans. If the AMOC shuts down5, it would cause significant cooling along the east coast of the U.S. and Western Europe. This, in turn, would alter rainfall patterns, make sea levels rise, cause more drying, and reduce agriculture in the U.K. and in extended regions in Western Europe, that are now experiencing a relatively mild sea-climate.
Thawing permafrost: Permafrost is ground that remains frozen for two or more consecutive years and is composed of rock, soil, sediments, and ice. Some permafrost has been frozen for tens or hundreds of thousands of years. As it warms and thaws the permafrost6, microbes come out of hibernation and break down the organic carbon in the soil, releasing CO2 and methane, which then trigger even more warming and melting. The 2019 Arctic Report Card from NOAA7 found that the Arctic’s thawing permafrost could be releasing 300 to 600 million tons of carbon per year into the atmosphere.
ENSO: El Niño and La Niña are the warm and cool, naturally occurring weather patterns across the tropical Pacific—the El Niño-Southern Oscillation, or ENSO. Every two to seven years, the pattern alternates, bringing disruptions in temperature and precipitation. As the ocean warms, it could push ENSO past a tipping point, which would make El Niño events more severe and frequent and could increase drought in the Amazon.
Tipping point interactions: A recent study of the WAIS8, the Greenland ice sheet, the AMOC, ENSO, and the Amazon rainforest tipping points found that they could interact with one another before temperatures reach 2°C. This interaction would enable tipping to occur at lower thresholds than previously expected.
Future or Last Steps
The EU is committed to mitigating climate emissions and tackle climate risk through adaptation. With the Green Deal for Europe9 it strives to achieve climate neutrality by 2050 and adopt a new, more ambitious climate change adaptation strategy. The Strategy10 has four principle objectives: to make adaptation smarter, swifter and more systemic, and to step up international action on adaptation to climate change.
Global environmental change has forced us to reconsider our relationship to nature. In Michel Serres’ book “Le Contrat Naturel”, the author calls for a natural contract to be negotiated between Earth and its inhabitants. Our survival depends on the extent to which humans join together and act globally, on an earth now conceived as an entity.
Michel Serres wonders11:
Who am I? A tremor of nothingness, living in a permanent earthquake. Yet for a moment of profound happiness, the spasmodic Earth comes to unite herself with my shaky body. Who am I, now, for several seconds? Earth herself. Both communing, in love she and I, doubly in distress, throbbing together, joined in a single aura. I saw her formerly with my eyes and my understanding; at last, through my belly and my feet, through my sex I am her. Can I say that I know her? Would I acknowledge her as my mother, my daughter, and my lover together? Should I let her sign?
[Michel Serres, The Natural Contract]
1 “Climate action: ‘Time is running out’, UN chief tells ministers”, https://news.un.org/en/story/2021/09/1101772
2 IPCC Sixth Assessment Report, https://www.ipcc.ch/assessment-report/ar6/
3 A European Green Deal, https://ec.europa.eu/info/strategy/priorities-2019-2024/european-green-deal_en
4 Antarctic Ice Sheet melting to lift sea level higher than thought, https://news.harvard.edu/gazette/story/2021/04/study-says-antarctic-ice-sheet-melt-to-lift-sea-level-higher-than- thought/
5 Changes in Ocean ‘Conveyor Belt’ Foretold Abrupt Climate Changes by Four Centuries, https://news.climate.columbia.edu/2019/03/20/amoc-ocean-conveyor-belt-climate-change/
6 Why Thawing Permafrost Matters, https://news.climate.columbia.edu/2018/01/11/thawing-permafrost-matters/
7 Arctic Report Card 2019, https://arctic.noaa.gov/Portals/7/ArcticReportCard/Documents/ArcticReportCard_full_report2019.pdf
8 Interacting tipping elements increase risk of climate domino effects under global warming, https://esd.copernicus.org/articles/12/601/2021/
9 European Green Deal, https://ec.europa.eu/info/strategy/priorities-2019-2024/european-green-deal_en
10 EU Adaptation Strategy, https://ec.europa.eu/clima/eu-action/adaptation-climate-change/eu-adaptation- strategy_en
11 Michel Serres, Le contrat naturel, Paris, 1990, pg. 124
- Scientific Background/Collaboration
Based on the PCC Sixth Assessment Report and on the SPM_Figure_8a we can get the global surface temperature changes in °C relative to 1850–1900. These changes were obtained by combining Coupled Model Intercomparison Project Phase 6 (CMIP6) model simulations with observational constraints based on past simulated warming, as well as an updated assessment of equilibrium climate sensitivity. Changes relative to 1850–1900 based on 20- year averaging periods are calculated by adding 0.85°C (the observed global surface temperature increase from 1850–1900 to 1995–2014) to simulated changes relative to 1995–2014. For the future projections Shared Socioeconomic Pathways (SSPs) scenarios are used. SSP are scenarios of projected socioeconomic global changes up to 2100. They are used to derive greenhouse gas emissions scenarios with different climate policies.

The data of the above diagram are available in csv format from the IPCC website14.
Shared Socioeconomic Pathways (SSPs) are scenarios of projected socioeconomic global changes up to 2100. They are used to derive greenhouse gas emissions scenarios with different climate policies.
The scenarios are:
- SSP1: Sustainability (Taking the Green Road)
- SSP2: Middle of the Road
- SSP3: Regional Rivalry (A Rocky Road)
- SSP4: Inequality (A Road divided)
- SSP5: Fossil-fueled Development (Taking the Highway)

The IPCC Sixth report did not estimate the likelihoods of the scenarios but a 2020 commentary described SSP5-8.5 as highly unlikely, SSP3-7.0 as unlikely, and SSP2-4.5 as likely15.
However, a report citing the above commentary shows that RCP8.5 is the best match to the cumulative emissions from 2005 to 202016.
14 IPCC Sixth Assessment Report Data, https://www.ipcc.ch/report/ar6/wg1/figures/summary-for-policymakers/ figure-spm-8
15 Emissions – the ‘business as usual’ story is misleading, https://www.nature.com/articles/d41586-020-00177-3
16 RCP8.5 tracks cumulative CO2 emissions, https://www.pnas.org/doi/full/10.1073/pnas.2007117117
- Additional context & background
The Residencies
JRC Residency One
During my first week of residency at the Joint Research Centre in Ispra, I will collaborate with the scientist to research available historical data on greenhouse gases and temperature change, as well as available future projection models. The method for mapping these data to metronome frequencies will also be discussed and researched with the scientist. Computer software will be used to simulate installation behaviour. The details of the metronome design (size, materials, etc.) and implementation methods (3D print, wood, etc.) will also be decided during this phase.
JRC Residency Two
During my second week-long residency at the Joint Research Centre in Ispra, I will present a working prototype of one metronome and test various data mapping methods with the scientist. During this phase, the final configuration of the metronomes (circular, linear, or other) as well as the total number of metronomes will be determined.
- Technical Framework
-

Each metronome will be custom-made. The basic patrs of the metronome are:
- A light flat bar made of aluminum with a COB led strip on both sides.
- A servo motor for moving the light flat bar.
- A speaker to produce the “ticking” sound.
- An Arduino Nano for controlling the servo and playing audio through the speaker
- A case that will contain the components.
All metronomes will be linked to a central Arduino, which will provide data and control the entire installation.
A circular arrangement of 24 metronomes with a 6m diameter is proposed.

Budget
- Budget
This is a cost estimate for the proposed installation of 24 custom metronomes. If we decide to change the total number of metronomes, the final cost will be affected.
Description Cost (€) 24 Servo motors 1,200 24 Arduino Nano 750 24 Speakers 250 17m COB light Strip 200 9m Aluminium flat bar 70 1 Arduino Uno 30 Various Cables/Components 100 Power Supply 50 Case & base 200 Construction/Implementation 1,500 TOTAL 4,350 NOTE: Artist fee have not been included in accordance with the guidelines.
Documents
Kranidiotis, Yannis_The Tipping Point_Proposal_20220830.pdf